Students Use GIS-Based Maps, Apps to Study the Effects of the Pandemic
 Throughout the COVID-19 pandemic, the public has relied on dynamic visualizations in the form of maps and apps to keep up-to-date with the spread of the disease on both local and global scales.
And with the use of geo-enabled apps, individuals can locate COVID-19 testing and vaccination sites, order groceries and other goods online, find uncrowded outdoor spaces, and track and even map the number of available medical resources in area hospitals.
“All of these services are available due to geographic information systems (GIS),” said Kim Diver, associate professor of the practice in earth and environmental sciences. “By using spatiotemporal visualizations, we can provide citizens, researchers, health care providers, and policy makers with a powerful analytical framework for visualization, data exploration, spatial pattern recognition, response-planning, and decision-making during the current pandemic.”
During the 2020-21 Winter Session, held Jan. 4–20, 17 Wesleyan students who enrolled in Diver’s E&ES271: Mapping the Pandemic course developed spatial thinking and visualization skills relevant to COVID-19. Students learned to critically evaluate existing maps and apps related to the current pandemic, explored how to use ArcGIS Online software to analyze and visualize data spatially, and created their own maps, stories, and apps. Class meetings, held over Zoom, included case study lectures/discussions, instructor-led skill-building workshops, studio work sessions, and critique sessions. The course was aimed at students with limited or no prior GIS experience.
The class culminated with students creating their own web apps to visualize COVID-19 data. Each of the students approached the pandemic from a different perspective for their final assignments. Topics ranged from vaccination locators to mapping inequities that have become more pronounced during the pandemic.
“The students created impressive, professional-quality dashboards, maps, and story maps in a short amount of time,” Diver said. “The diversity of topics speaks to the myriad, and sometimes hidden, ways that the pandemic has infiltrated every aspect of our lives.”
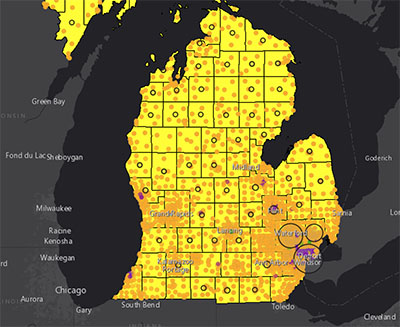
Perri Easely ’23 focused her project on Charting the Racial Disparities of COVID-19 in Detroit, Mich. According to the U.S. Census, African Americans make up only 14.1% of Michigan’s population. However, they accounted for nearly 29.4% of COVID-19 cases and 40% of deaths since the outbreak in March 2020.
“Michigan was among the first states to release data by racial demographic, making these statistics among the first to receive nationwide attention concerning the stark racial disparities of the pandemic,” she explained in her app with a correlating GIS map of Michigan Racial Demographics and COVID-19 cases by county.
Easely also included a map of resources for COVID-19 relief available in Detroit, which includes locations of free food services, testing sites, public housing buildings, and bus stops.
Sophie Scobell ’22, a biology and College of East Asian Studies double major, named her research “Cultural Habits May Be the Secret to Pandemic Survival.”
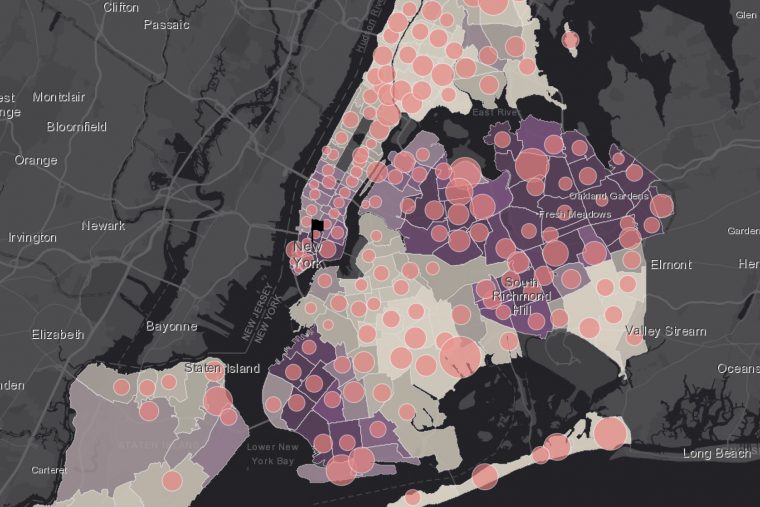
In China and neighboring Asian countries, Scobell noted, residents were accustomed to wearing masks even before the COVID-19 pandemic as a means to prevent transmission of other diseases, due to respect for elders and the importance of collective welfare. She hypothesized that Chinese communities in New York City would have significantly lower case and death rates based on this ingrained behavior.
Although Scobell was able to determine that COVID-19 case rates and death rates in and around Chinatown in New York City are significantly lower than other neighborhoods of the city, she wasn’t able to account for why. When total populations of races and ethnicities in New York City are observed, however, Scovill determined that the Asian/Pacific-Islander group has a lower case rate and death rate than the white, Black/African American, and Hispanic/Latino groups.
“Many other factors, aside from cultural habits, are at play when mapping COVID-19 case rates and death rates,” she said. “In order to fully understand the disparity in how different populations are affected by the pandemic, population density, socioeconomic status, preexisting conditions, proximity to hospitals, etc., should be taken into account. Additional research on use of herbal medicines among different populations in New York City would also be very interesting.”
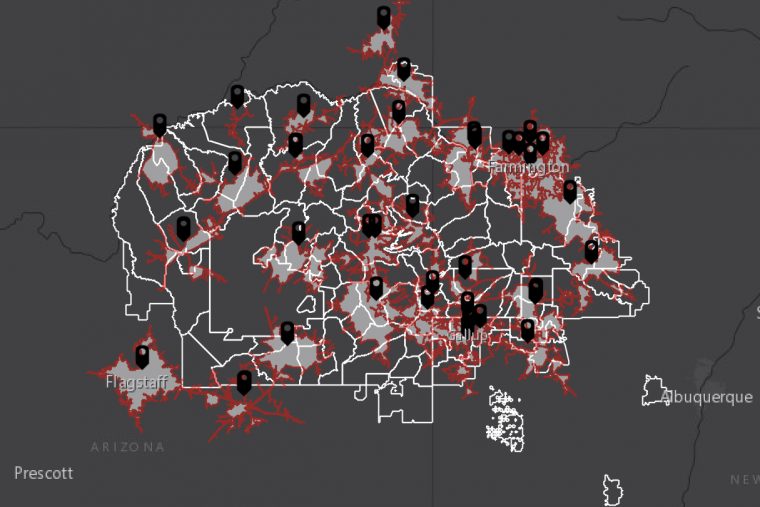
When Anna Buchmueller ’22 learned that in June 2020, Navajo Nation, the Native American reservation located in the southwest, was harder-hit by COVID-19 than New York, she decided to focus her project on COVID-19 Testing Locations and Cases in the Navajo Nation. The reservation, spanning the size of West Virginia, had an infection rate of 3.4% compared to that of New York state’s 1.9%
Buchmueller, an American studies and theater double major, discovered through two existing maps that a significant proportion of Navajo Nation’s population, specifically in the Western half, must travel more than 30 minutes to obtain a COVID-19 test.
“While these two maps are just scratching the surface of the distress that Navajo Nation has been forced to face amidst this pandemic, I believe they highlight the systemic issues that Native American reservations across the country face regarding assistance from the United States federal government,” she said.
Additional class projects are below. Click on the titles or images to open a project. (Some projects are not shared publicly.)
Prison Life During a Pandemic by Nora Butler (’24)
COVID-19 Cases and Vaccinations Dashboard by David Gottleib (’22 GOVT)
Unemployment in America by Sophie Griffin (’23)
COVID-19 Testing and Vaccination Locations by Elizabeth Irvin (’23)
US School Closures by Madeleine Matz (’21 ANTH, ENGL)
Mapping Connecticut School Closure Models by Joshua Merkin (’23 ARHA)
Vaccine Locations by Ava Nederlander (’22 CIS, COMP)
Economic Vulnerability in the US due to COVID-19 by Aashni Parikh (’22 E&ES, BIOL)
COVID-19 Rates in LA During Wildfire Areas by Sophie Penn (’23)
Rates of COVID-19 in a Racially Segregated City by Shea Peretz (’21 CSS, GOVT)
Healthcare Investment in Indonesia by Gabriel Snashall (’21 ENVS, GOVT)
Mapping Inequities in Abortion Access During COVID-19 by Claudia Stagoff-Belfort (’21 BIOL, SISP)
COVID-19 and the National Suicide Prevention Lifeline by Anna Tjeltveit (’23)
Gender and COVID-19 in Afghanistan by Karen Xu (’22 ARST, ENGL)